Python: Imágenes y píxeles#
El objetivo de estas secciones es ofrecer una ilustración interactiva de los conceptos del análisis de imágenes a través del popular lenguaje de programación Python.
Siéntase libre de saltarse esto.
Si le interesan más los conceptos y/o ImageJ, le recomendaría que se saltara los capítulos de Python del principio - no los necesita para comprender el resto del libro.
Sin embargo, si le interesa, espero que estas secciones puedan ayudar a ofrecerle una visión alternativa del análisis de imágenes.
Aunque nunca haya programado antes, los ejemplos le ayudarán a comprender mejor el procesamiento de imágenes y a adquirir algunos conocimientos útiles de programación.
Esta página introducirá la lectura y visualización de imágenes. Los capítulos posteriores de Python en el manual se basarán en estos fundamentos.
Hágalo interactivo.
Antes de continuar, debería hacer el cuaderno interactivo para que pueda ejecutar el código usted mismo - y explorar qué ocurre si hace cambios.
Descripción general de Python
Si quiere una introducción rápida a Python, consulte la sección Python Primer.
Para más información, consulte [Bio-image Analysis Notebooks] de Robert Haase (https://haesleinhuepf.github.io/BioImageAnalysisNotebooks/).
Leer y mostrar una imagen con Python #
Empecemos cargando una imagen en Python, y mostrándola después utilizando matplotlib.
"""
Read and display an image in Python.
"""

# In Python, we need to import things before we can use them
# (And, often, google to find out what we ought to be importing,
# then copy & paste the same import statements a lot)
import matplotlib.pyplot as plt
from imageio import imread

# Read an image - we need to know the full path to wherever it is
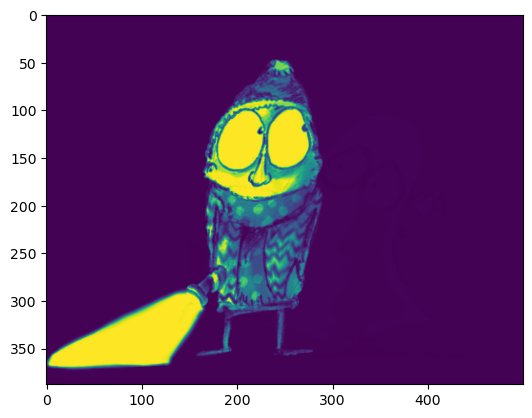
im = imread('../../../images/spooked.png')

# Create a plot of the image using the default brightness/contrast min/max and colormap
plt.imshow(im)

# Actually show the plot (if we don't do this explicitly, it might display anyway - but not always)
plt.show()
/tmp/ipykernel_2835/3771718922.py:12: DeprecationWarning: Starting with ImageIO v3 the behavior of this function will switch to that of iio.v3.imread. To keep the current behavior (and make this warning disappear) use `import imageio.v2 as imageio` or call `imageio.v2.imread` directly.
  im = imread('../../../images/spooked.png')
Modificación de las tablas de consulta (LUTs)#
El método clave aquí es plt.imshow. Podemos introducir parámetros adicionales para personalizar la visualización de muchas maneras.
Para ver qué es posible, suelo empezar a escribir el nombre y luego pulsar Shift+Tab para que aparezca algo de documentación.
plt.imshow(
Alternativamente, puede ejecutar cualquiera de las siguientes líneas
?plt.imshow
help(plt.imshow)
para mostrar un texto de ayuda.
help(plt.imshow)
Help on function imshow in module matplotlib.pyplot:

imshow(X: 'ArrayLike | PIL.Image.Image', cmap: 'str | Colormap | None' = None, norm: 'str | Normalize | None' = None, *, aspect: "Literal['equal', 'auto'] | float | None" = None, interpolation: 'str | None' = None, alpha: 'float | ArrayLike | None' = None, vmin: 'float | None' = None, vmax: 'float | None' = None, origin: "Literal['upper', 'lower'] | None" = None, extent: 'tuple[float, float, float, float] | None' = None, interpolation_stage: "Literal['data', 'rgba'] | None" = None, filternorm: 'bool' = True, filterrad: 'float' = 4.0, resample: 'bool | None' = None, url: 'str | None' = None, data=None, **kwargs) -> 'AxesImage'
    Display data as an image, i.e., on a 2D regular raster.

    The input may either be actual RGB(A) data, or 2D scalar data, which
    will be rendered as a pseudocolor image. For displaying a grayscale
    image, set up the colormapping using the parameters
    ``cmap='gray', vmin=0, vmax=255``.

    The number of pixels used to render an image is set by the Axes size
    and the figure *dpi*. This can lead to aliasing artifacts when
    the image is resampled, because the displayed image size will usually
    not match the size of *X* (see
    :doc:`/gallery/images_contours_and_fields/image_antialiasing`).
    The resampling can be controlled via the *interpolation* parameter
    and/or :rc:`image.interpolation`.

    Parameters
    ----------
    X : array-like or PIL image
        The image data. Supported array shapes are:

        - (M, N): an image with scalar data. The values are mapped to
          colors using normalization and a colormap. See parameters *norm*,
          *cmap*, *vmin*, *vmax*.
        - (M, N, 3): an image with RGB values (0-1 float or 0-255 int).
        - (M, N, 4): an image with RGBA values (0-1 float or 0-255 int),
          i.e. including transparency.

        The first two dimensions (M, N) define the rows and columns of
        the image.

        Out-of-range RGB(A) values are clipped.

    cmap : str or `~matplotlib.colors.Colormap`, default: :rc:`image.cmap`
        The Colormap instance or registered colormap name used to map scalar data
        to colors.

        This parameter is ignored if *X* is RGB(A).

    norm : str or `~matplotlib.colors.Normalize`, optional
        The normalization method used to scale scalar data to the [0, 1] range
        before mapping to colors using *cmap*. By default, a linear scaling is
        used, mapping the lowest value to 0 and the highest to 1.

        If given, this can be one of the following:

        - An instance of `.Normalize` or one of its subclasses
          (see :ref:`colormapnorms`).
        - A scale name, i.e. one of "linear", "log", "symlog", "logit", etc.  For a
          list of available scales, call `matplotlib.scale.get_scale_names()`.
          In that case, a suitable `.Normalize` subclass is dynamically generated
          and instantiated.

        This parameter is ignored if *X* is RGB(A).

    vmin, vmax : float, optional
        When using scalar data and no explicit *norm*, *vmin* and *vmax* define
        the data range that the colormap covers. By default, the colormap covers
        the complete value range of the supplied data. It is an error to use
        *vmin*/*vmax* when a *norm* instance is given (but using a `str` *norm*
        name together with *vmin*/*vmax* is acceptable).

        This parameter is ignored if *X* is RGB(A).

    aspect : {'equal', 'auto'} or float or None, default: None
        The aspect ratio of the Axes.  This parameter is particularly
        relevant for images since it determines whether data pixels are
        square.

        This parameter is a shortcut for explicitly calling
        `.Axes.set_aspect`. See there for further details.

        - 'equal': Ensures an aspect ratio of 1. Pixels will be square
          (unless pixel sizes are explicitly made non-square in data
          coordinates using *extent*).
        - 'auto': The Axes is kept fixed and the aspect is adjusted so
          that the data fit in the Axes. In general, this will result in
          non-square pixels.

        Normally, None (the default) means to use :rc:`image.aspect`.  However, if
        the image uses a transform that does not contain the axes data transform,
        then None means to not modify the axes aspect at all (in that case, directly
        call `.Axes.set_aspect` if desired).

    interpolation : str, default: :rc:`image.interpolation`
        The interpolation method used.

        Supported values are 'none', 'antialiased', 'nearest', 'bilinear',
        'bicubic', 'spline16', 'spline36', 'hanning', 'hamming', 'hermite',
        'kaiser', 'quadric', 'catrom', 'gaussian', 'bessel', 'mitchell',
        'sinc', 'lanczos', 'blackman'.

        The data *X* is resampled to the pixel size of the image on the
        figure canvas, using the interpolation method to either up- or
        downsample the data.

        If *interpolation* is 'none', then for the ps, pdf, and svg
        backends no down- or upsampling occurs, and the image data is
        passed to the backend as a native image.  Note that different ps,
        pdf, and svg viewers may display these raw pixels differently. On
        other backends, 'none' is the same as 'nearest'.

        If *interpolation* is the default 'antialiased', then 'nearest'
        interpolation is used if the image is upsampled by more than a
        factor of three (i.e. the number of display pixels is at least
        three times the size of the data array).  If the upsampling rate is
        smaller than 3, or the image is downsampled, then 'hanning'
        interpolation is used to act as an anti-aliasing filter, unless the
        image happens to be upsampled by exactly a factor of two or one.

        See
        :doc:`/gallery/images_contours_and_fields/interpolation_methods`
        for an overview of the supported interpolation methods, and
        :doc:`/gallery/images_contours_and_fields/image_antialiasing` for
        a discussion of image antialiasing.

        Some interpolation methods require an additional radius parameter,
        which can be set by *filterrad*. Additionally, the antigrain image
        resize filter is controlled by the parameter *filternorm*.

    interpolation_stage : {'data', 'rgba'}, default: 'data'
        If 'data', interpolation
        is carried out on the data provided by the user.  If 'rgba', the
        interpolation is carried out after the colormapping has been
        applied (visual interpolation).

    alpha : float or array-like, optional
        The alpha blending value, between 0 (transparent) and 1 (opaque).
        If *alpha* is an array, the alpha blending values are applied pixel
        by pixel, and *alpha* must have the same shape as *X*.

    origin : {'upper', 'lower'}, default: :rc:`image.origin`
        Place the [0, 0] index of the array in the upper left or lower
        left corner of the Axes. The convention (the default) 'upper' is
        typically used for matrices and images.

        Note that the vertical axis points upward for 'lower'
        but downward for 'upper'.

        See the :ref:`imshow_extent` tutorial for
        examples and a more detailed description.

    extent : floats (left, right, bottom, top), optional
        The bounding box in data coordinates that the image will fill.
        These values may be unitful and match the units of the Axes.
        The image is stretched individually along x and y to fill the box.

        The default extent is determined by the following conditions.
        Pixels have unit size in data coordinates. Their centers are on
        integer coordinates, and their center coordinates range from 0 to
        columns-1 horizontally and from 0 to rows-1 vertically.

        Note that the direction of the vertical axis and thus the default
        values for top and bottom depend on *origin*:

        - For ``origin == 'upper'`` the default is
          ``(-0.5, numcols-0.5, numrows-0.5, -0.5)``.
        - For ``origin == 'lower'`` the default is
          ``(-0.5, numcols-0.5, -0.5, numrows-0.5)``.

        See the :ref:`imshow_extent` tutorial for
        examples and a more detailed description.

    filternorm : bool, default: True
        A parameter for the antigrain image resize filter (see the
        antigrain documentation).  If *filternorm* is set, the filter
        normalizes integer values and corrects the rounding errors. It
        doesn't do anything with the source floating point values, it
        corrects only integers according to the rule of 1.0 which means
        that any sum of pixel weights must be equal to 1.0.  So, the
        filter function must produce a graph of the proper shape.

    filterrad : float > 0, default: 4.0
        The filter radius for filters that have a radius parameter, i.e.
        when interpolation is one of: 'sinc', 'lanczos' or 'blackman'.

    resample : bool, default: :rc:`image.resample`
        When *True*, use a full resampling method.  When *False*, only
        resample when the output image is larger than the input image.

    url : str, optional
        Set the url of the created `.AxesImage`. See `.Artist.set_url`.

    Returns
    -------
    `~matplotlib.image.AxesImage`

    Other Parameters
    ----------------
    data : indexable object, optional
        If given, all parameters also accept a string ``s``, which is
        interpreted as ``data[s]`` (unless this raises an exception).

    **kwargs : `~matplotlib.artist.Artist` properties
        These parameters are passed on to the constructor of the
        `.AxesImage` artist.

    See Also
    --------
    matshow : Plot a matrix or an array as an image.

    Notes
    -----
    Unless *extent* is used, pixel centers will be located at integer
    coordinates. In other words: the origin will coincide with the center
    of pixel (0, 0).

    There are two common representations for RGB images with an alpha
    channel:

    -   Straight (unassociated) alpha: R, G, and B channels represent the
        color of the pixel, disregarding its opacity.
    -   Premultiplied (associated) alpha: R, G, and B channels represent
        the color of the pixel, adjusted for its opacity by multiplication.

    `~matplotlib.pyplot.imshow` expects RGB images adopting the straight
    (unassociated) alpha representation.
A veces, esto puede revelar una cantidad abrumadora de información, y puede llevar un poco de tiempo averiguar cómo identificar los elementos clave.
Las opciones de trazado importantes para nuestros fines son
cmappara cambiar el mapa de colores (LUT)vminpara cambiar el valor del píxel correspondiente al primer color en el mapa de coloresvmaxpara cambiar el valor del píxel correspondiente al último color en el mapa de colores
Las últimas dos opciones controlan el brillo/contraste.
Pruebe a ejecutar las siguientes líneas de código para ver el efecto, y pruebe otros cambios.
"""
Display an image with different brightness/contrast.
(Be sure to run the cells above before this one!)
"""

# Display the image with a grayscale colormap
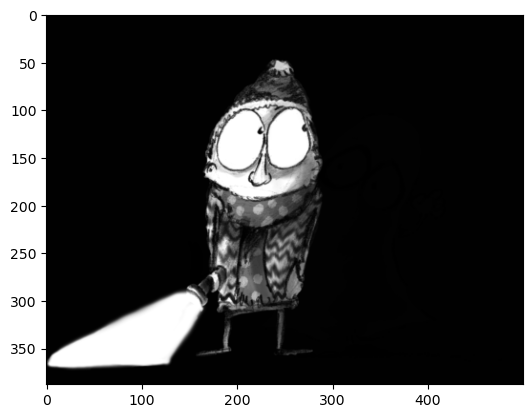
plt.imshow(im, cmap='gray')
plt.show()
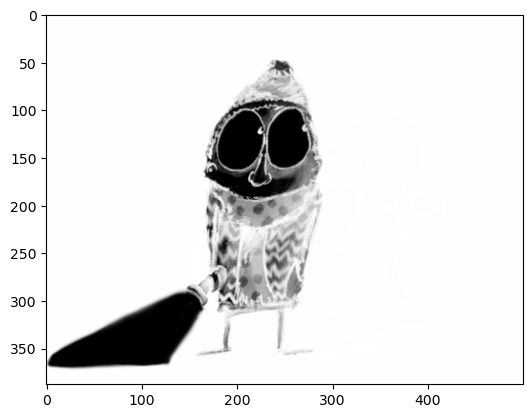
# Create an X-ray by adding '_r' to 'reverse' the colormap
plt.imshow(im, cmap='gray_r')
plt.show()
# Display the image with a grayscale colormap and modified brightness/contrast
plt.imshow(im, cmap='gray', vmin=100, vmax=255)
plt.show()
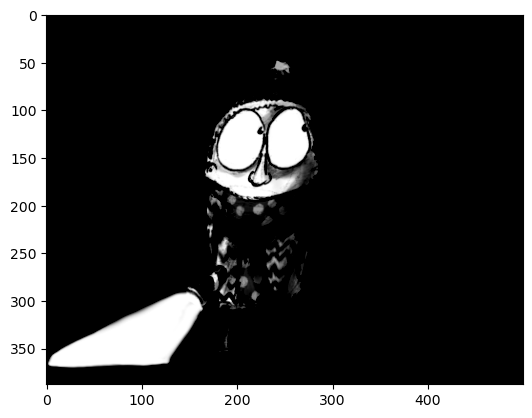
# Display the image with a grayscale colormap and modified brightness/contrast
plt.imshow(im, cmap='gray', vmin=0, vmax=8)
plt.show()
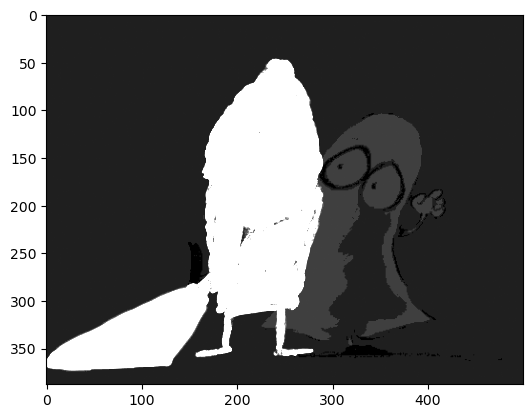
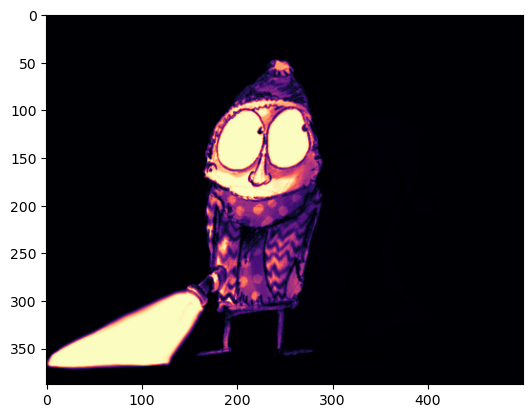
Hay muchos más mapas de colores disponibles en matplotlib – para más detalles, vea https://matplotlib.org/stable/tutorials/colors/colormaps.html.
# Display with a 'perceptually uniform colormap'
plt.imshow(im, cmap='magma')
plt.show()
# Display with a colormap that is, frankly, not very helpful here
plt.imshow(im, cmap='hsv')
plt.show()
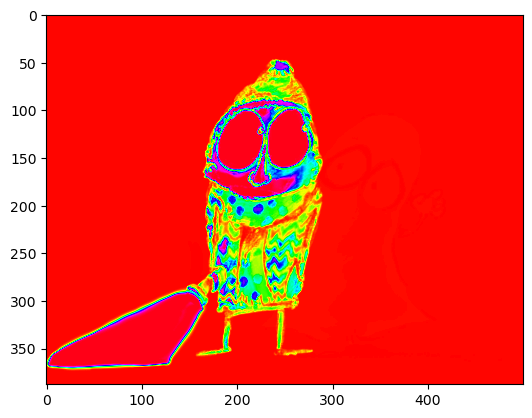
Como puede ver, la imagen puede tener un aspecto muy diferente según el mapa de colores y los valores mín./máx. utilizados.
Sin embargo, es crucial recalcar que no hemos modificado los datos de la imagen original en sí.
Para comprobarlo, pruebe a mostrar la imagen como lo hicimos inicialmente, para asegurarse de que se ve igual.
# Display the image as before
plt.imshow(im)
plt.show()

Personalizar aún más la visualización de imágenes#
Se puede hacer mucho más para personalizar la apariencia.
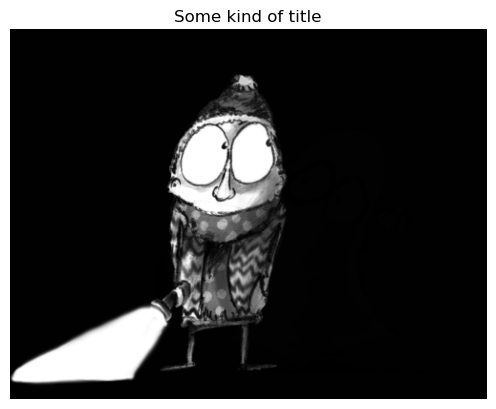
Para estandarizar las cosas a lo largo de este libro, normalmente desactivo el eje exterior (números alrededor del límite), establezco un título de imagen y utilizo una tabla de consulta (LUT) en escala de grises.
El código para hacer esto se muestra a continuación.
# Load and display an image with a title & no visible axis
im = imread('../../../images/spooked.png')

plt.imshow(im, cmap='gray')
plt.axis(False)
plt.title('Some kind of title')
plt.show()
/tmp/ipykernel_2835/2843473488.py:2: DeprecationWarning: Starting with ImageIO v3 the behavior of this function will switch to that of iio.v3.imread. To keep the current behavior (and make this warning disappear) use `import imageio.v2 as imageio` or call `imageio.v2.imread` directly.
  im = imread('../../../images/spooked.png')
Funciones de escritura#
Si utiliza las mismas personalizaciones con frecuencia, resulta útil definir una función que las aplique. Así no tendrá que copiar y pegar con frecuencia las mismas líneas de código, sino que bastará con que llame a la función.
La definición de una función empieza por
def, a lo que le sigue
El nombre de la función
Parámetros (entre paréntesis), a veces con valores predeterminados
Dos puntos (:)
El código principal que implementa la función - esto necesita tener una sangría (algo con lo que Python es muy quisquilloso)
def my_imshow(im, title=None, cmap='gray'):
    """
    Call imshow and turn the axis off, optionally setting a title and colormap.
    The default colormap is 'gray', and there is no default title.
    """

    # Show image & turn off axis
    plt.imshow(im, cmap=cmap)
    plt.axis(False)

    # Show a title if we have one
    if title is not None:
        plt.title(title)

    plt.show()

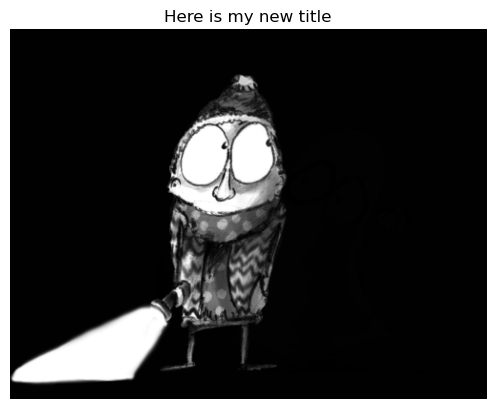
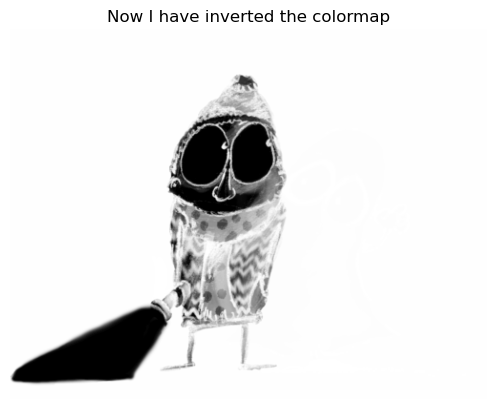
# Now I just need to call my function rather than customize every plot
my_imshow(im, title='Here is my new title')
my_imshow(im, title='Now I have inverted the colormap', cmap='gray_r')
Funciones auxiliares de este libro#
He escrito varias funciones de ayuda para estandarizar la visualización de imágenes a lo largo de este manual. No forman parte de alguna biblioteca más amplia de Python, pero podemos usarlas aquí para hacer nuestros scripts más cortos y centrarnos en los conceptos más importantes.
Para utilizar estas funciones de ayuda, tenemos que importarlas una vez por cada cuaderno Jupyter. A continuación, podemos utilizar los métodos como load_image y show_image (junto con elementos como show_histogram) para mostrar imágenes.
# Default imports (they are already included at the top of the page)
import sys
sys.path.append('../../../')
from helpers import *
# Easier way to load and display an image, which we'll use from now on
im = load_image('sunny_cell.tif')
show_image(im, title='A new title')
